# Week 3 - Types of Data {-}
Welcome to week 3 of data librarianship! This week, we are focusing on understanding the different types of data that data librarians encounter throughout their work.
## Overview {-}
**This week**, you all should:
+ Read/watch [the lecture](week-3-types-of-data.html#lecture)
+ Complete [homework 2](week-3-types-of-data.html#homework-02)!
+ Check your understanding of GIS data with a practice quiz (ungraded)
+ Check your understanding of quantitative data with a practice quiz (ungraded)
+ Submit your final project idea (non-binding and ungraded, I just want an idea of what you are thinking of!)
+ Read the articles for this week before our live discussion via Zoom on Thursday, September 2nd at 6:30 - 7:30pm Eastern
## Lecture {-}
Welcome to week 3 of data librarianship! I'll wanted to briefly note throughout this lecture I say "researchers" to describe "patrons" -- this is simply because as a data librarian at a museum and then in academia, I have more experience with this group and it's kind of my default. But what I'm about to go over will apply to any setting, or title for our patrons. Everyone across industries works with at least one of the following data types that I'm going to go over in this lecture.
So let's start by first actually discussing infrastructure. To do any data- and computationally-intensive work, you need infrastructure to support it - for storage, managing multiple versions of files, publishing, and sharing. In 2019, the **CARE principles** for Indigenous Data Governance were published by the Global Indigenous Data Alliance. I think these principles are important to consider when we, as data librarians, are either designing or collaborating on research infrastructure. These principles are meant to provide a framework for governance of infrastructure underlying infrastructure for research. The CARE principles are "people and purpose-oriented, reflecting the crucial role of data in advancing Indigenous innovation and self-determination." Let's go over each of the letters in the acronym CARE:
**C** is for **Collective Benefit**. Three principles under this heading include inclusive development and innovation, improved governance and citizen engagement, and equitable outcomes. These principles are meant to foreground how data ecosystems should design and function.
**A** is for **Authority to Control**. Three principles under this heading include recognizing rights and interests, data for governance, and governance of data. This set of principles are about how data should be governed, and asserts collective and individual rights for Indigenous Peoples in control of their data.
**R** is for **Responsibility**. Three principles under this heading include responsibility for positive relationships (based on respect, reciprocity, and trust), for expanding capability and capacity (such as enhancing data literacy), and for Indigenous languages and worldviews.
**E** is for **Ethics**. Three principles under this heading include minimizing harm and maximizing benefit, justice, and future use.
CARE is meant to interoperate with and underlie existing principles in the open data and data interoperability movements, such as **FAIR**! So the idea behind FAIR data standards was to come up with a "a minimal set of community-agreed guiding principles and practices, data providers and data consumers - both machine and human - could more easily discover, access, interoperate, and sensibly re-use, with proper citation, the vast quantities of information being generated by contemporary data-intensive science.” I also note that FAIR data can be big, qualitative, quantitative, or spatial! It applies across data types, and specifically deals with the specifics of the files themselves.
Let's go over each of the letters in the acronym FAIR:
**F** is for **Findable**, which says that data should have "minimally contain basic machine actionable metadata that allows it to be distinguished from other Data Objects; uniquely and persistently identifiable." This means that data should have structured metadata, in a format like JSON-LD (popular for data) or Geo-JSON for GIS data. It also says that the data should have a unique and persistent identifier -- DOIs, or Digital Object Identifiers, are the predominant way to do this now, even though they weren't really designed with data in mind. DOIs are basically trying to be permanent links to digital objects by pointing to a metadata record for a digital object, like a dataset or journal article, that can be updated if the URL to that digital object changes.
**A** is for **Accessible**, which means that the digital object can "always obtained by machines and humans (with authorization)" and "machines and humans alike will be able to judge the actual accessibility of each Data Object." So I personally think that the authors made this one intentionally vague, to allow for every interpretation of "accessible," including ones that include accessibility for users that might want to access the data through, for instance, screen readers. The ability to always obtain the object is important (with authorization, which is important for sensitive data needs), and the emphasis that computers can open it (with software that runs) and humans can judge it forefront that both needs are important.
**I** is for **Interoperable**, which forefronts "machine-actionable" data, which are stored in "formats that utilize shared vocabularies and/or ontologies" and that are "syntactically parseable and semantically machine-accessible." So this is a real mouthful, but it speaks to basic best practices for digital archiving actually. We want our digital objects -- data, code, whatever -- to be in an open, well-documented format. A major problem that I help people with as a data librarian is that they receive data in formats that are gone -- one example is from a computer science student that received a database in a NexusDB format - the company that made this went out of business in the early 2000s, and the only way we could recover the data was to pirate a copy of the software that can open it -- we couldn't even buy it!
**R** is for **Re-usable**, last but not least, says that you must be compliant with the rest of the acronym F,A,I. It also dictates that "(meta) data should be sufficiently well-described and rich that it can be automatically (or with minimal human effort) linked or integrated, like-with-like, with other data sources". This means that we should be able to index and discover data in many different types of systems, like across different institutions and disciplines. This is the most underappreciated part of FAIR in my opinion, and one of the most important. Finally, it says that data should have "rich enough metadata and provenance to enable proper citation." We want people to get credit for the work that they do, and citations are the predominant way that we do that with data.
The point is to make data and metadata stewardship normalized, and to forefront that data and research materials of all types should be understandable in the long-term by both machines and people.
Moving on, **big data** is really hot right now and there's lots of snubbery around what constitutes "big”. I typically say, if you can't open it on your local computer, then it's big. This could mean data that is hundreds of GigaBytes, data that is a TeraByte or PetaByte big, or millions of small files that have to be used in conjunction to make sense, but also amount to a large amount of combined storage. From our reading for this week, we see that big data has the following characteristics and problems:
+ *Volume*: the sheer scale of information -- can be just one massive datum, or trillions of small files that amount to a lot when combined.
+ *Variety*: of the sources that the data comes from, which often also vary in quality greatly.
+ *Velocity*: of the incoming data -- literally the speed at which data moves through the computer system. You might imagine that big data requires a lot of bandwidth, especially with real-time applications as the norm these days. So this matters.
+ *Veracity*: this refers to the quality and accuracy of the data. Big data is often sourced from a variety of sources and complexities that can lead to challenges in quality assurance and screening.
Big data can also be defined by the processes and computing strategies and technologies used to handle the large datasets. Working with big data follows similar steps to working with normal-sized data:
+ Ingesting the data
+ Storing it securely
+ Cleaning it up
+ Analyzing it
+ Visualizing the results
To do this with big data, however, you need a computer that can perform faster and at a larger scale than your desktop. This is called HPC in most places – high performance computing. There are significant challenges with scaling up processing and analyzing big data – imagine having a dataset that's a few TB big. You run a data cleanup program in the HPC environment that takes a few days to run, only to find out at the end that it didn't work the way you hoped. It gets real frustrating real fast. Typically you have to use the command line to access HPC. So a typical workflow might look like this:
1. SSH, or securely *log-in into a cluster*
2. Copy, scrape, or *transfer data* onto the storage layer of the cluster. These are typically distributed, which means that data is stored across multiple nodes to be accessed by compute resources. You won't notice this as the user.
3. *Run some data clean-up operations* via the command line, through python scripts, R scripts, bash, etc. These operations are typically about formatting the data similarly so the analysis pipelines run correctly, including filtering out poor quality or unnecessary data, or validating data to make sure its tidy and what you were expecting (like if you were expecting dates and got gene sequences).
4. *Run some analysis pipeline* via the command line, through python scripts, R scripts, bash, etc. Batch processing is one method that allows researchers to analyze large data – this consists of breaking up the data into smaller pieces, scheduling each piece on a different compute node, and calculating the final result after running some job (analysis script). Folks also use real-time processing, which means data is processed and immediately fed back into the pipeline, forcing the system to react to the new information.
5. *Visualize* what happened during the analysis – make some graph, time series, etc. that helps others understand what happened during the analysis stage.
I think one opportunities for libraries is to start collecting and serving big data for researchers, but we can talk about this during the collection development section of the course!
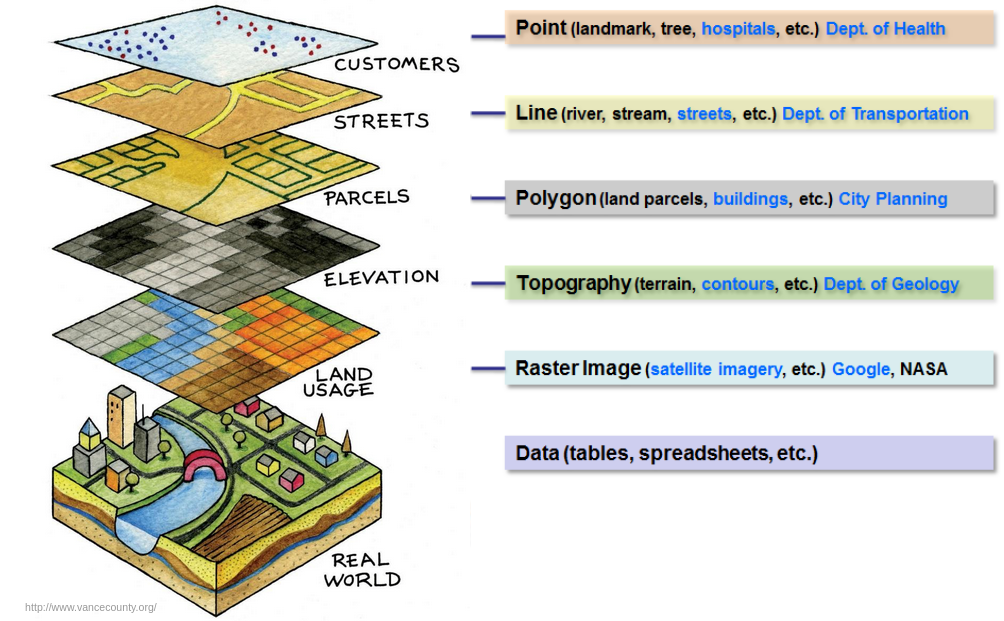
Onto **Geographic Information Systems (GIS)**, which is anything that integrates, stores, edits, analyzes, shares, and displays geographic information. GIS applications are tools that allow users to create interactive queries, analyze spatial information, edit data in maps, and present the results of all these operations. GIS applications work with a few types of data:
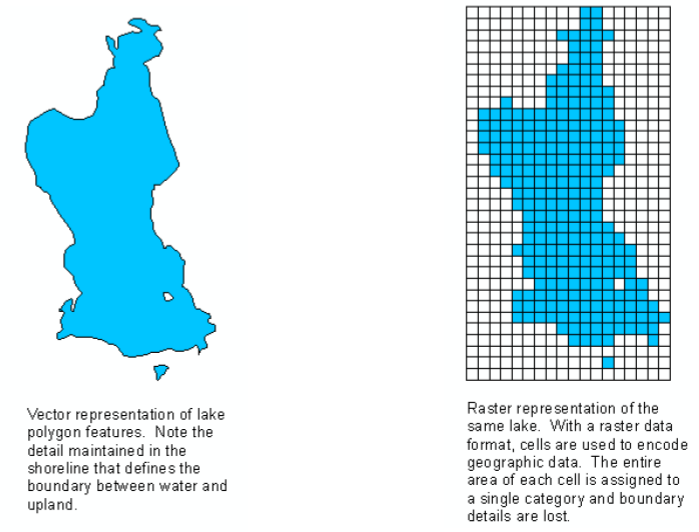
+ Raster data, which is stored as grids of values. If you zoom too close to raster data, you'll get a very pixelated image.
+ Vector data, which is stored as a series of X,Y coordinates. These are represented in points, lines, and areas.
These can be combined into layers to convey more information or analyze the data in more depth. Look at this example, which combines open GIS raster and vector data to create a fuller picture of the world:
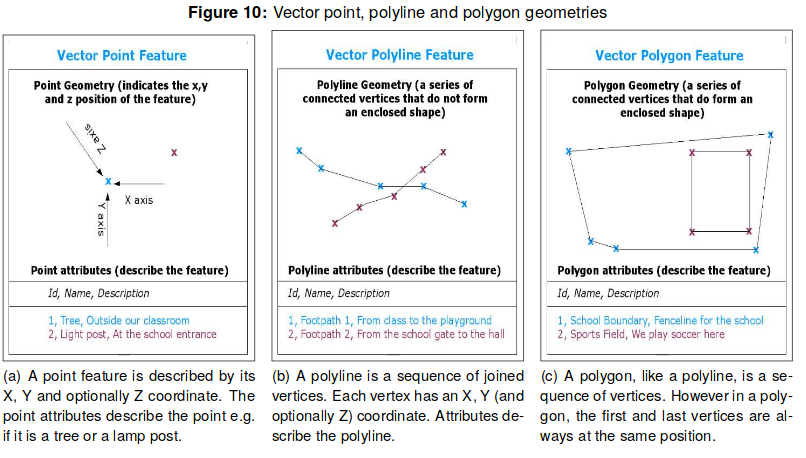
But before we get ahead of ourselves, let's look at these data types in a bit more detail. Vector data is a way to represent features in a GIS environment, or something you can see in the environment. Some examples of a features include libraries, trees, houses, museums, etc. Vector features have attributes, typically non-GIS data that describes it. Attributes can be numerical or not – whatever is most useful as a descriptor. Vector attributes are typically stored in tables where each row represents one instance or record, with one record per feature in the vector layer. Columns are called 'fields', and fields define the properties of each attribute, such as height, color, etc.
A vector feature is represented using geometry, specifically connected vertices (X,Y or X,Y,Z coordinates). If there's only one vertex, it's a point. If there's two, it's a line. If there's three or more where the first vertex is the same as the last, it's a polygon. From our GIS reading this week, we also know that:
> Vector data can be stored in a database, or as files. The most common format is a shapefile, which is a group of three or more files, typically .shp (geometry of vector features), .dbf (attributes of vector features), and .shx (index that helps GIS program find features quickly) files.
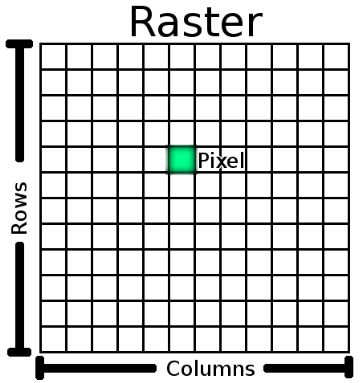
Raster data is a grid of regularly sized pixels. The size of those pixels determines the spatial resolution. Raster data is very good for showing continually varying information, and can provide a lot of interesting contextual data when layered with vector data. It often acts as the base upon which other layers are built. At the most basic level, raster data looks like this:
Next, **quantitative** research focuses on gathering numerical data and generalizing it to explain a particular phenomenon. The goal of quantitative studies is to determine the relationship between an independent variable and a dependent or outcome variable. Research that generates quantitative data typically fall into two categories:
+ *Descriptive*, where the subjects or phenomenon are measured once to establish associations between variables.
+ *Experimental*, where the subjects are measured before and after a treatment in the hopes of establishing causality. For more on causality and correlation, I invite you to play around with [Spurious Correlations](https://tylervigen.com/spurious-correlations)
In quantitative research, data is usually gathered through structured research instruments and results are based on large sample sizes. These are theoretically very replicable, though we'll get to that in week 6. All aspects of the study are designed before data is collecting to avoid HARKing – Hypothesizing After Results are Known. HARKing is defined as presenting a post hoc hypothesis as if it were an a priori hypothesis – basically, making the data fit the hypothesis instead of the other way around. It's seen as very inappropriate. Quantitative research attempts to generalize concepts widely as well as predict future causal relationships and future results.
The most common types of quantitative data you'll likely create through your own research, or be asked to find by patrons, are:
+ *Microdata*: information at the level of individual respondents (e.g. survey respondents)
+ *Aggregated data*: data combined from several measurements
+ *Statistics*: an aggregated description of datasets – they interpret or summarize datasets. The output of some kind of analysis and usually made to be read by humans (and machines).
When conducting quantitative research, you'll see a similar pattern to what we've seen above:
+ Identify your *research question* - what is the *problem or phenomenon being investigated*?
+ Identify the *conceptual framework* under which you'll do your work. What's your hypothesis?
+ Design your *methods* accordingly:
- How will you sample the population/phenomenon you plan on studying?
- How will you collect relevant information about it?
- How will you test that data to make sure it's accurate?
+ Data *analysis*
- What mathematical techniques, software, or instruments are you using to test your claims?
+ *Interpret* the results you found during analysis –
- Did the data refute or affirm your hypothesis?
- What trends did you see?
- What are the key implications of your work?
- What were the limitations and biases?
+ *Visualize* that ish! It helps present the numerical data in a succinct and precise manner (when done right). We'll discuss this more in week 5, but visualizations are key for both exploring and explaining data, especially quantitative data.
The key strengths of quantitative data is that there are generally larger sample sizes, which means that you can generalizable your results with more certainty. People say that quantitative research is more replicable than other types of research, though we'll discuss some of the myths that need busting in that regard in week 6. Another strength of collecting and analyzing quantitative data for research is that it allows you to summarize vast amounts of information & compare across categories. However, there are some limitations to research with quantitative data. For one, its missing contextual data. Quantitative data can often tell you the what or how, but not the why. Along those lines, there is a large chance for structural biases in quantitative datasets, especially because a good portion of quantitative data is gathered in an artificial environment (for instance, a lab). The majority of data you'd see as a data librarian will be quantitative, to be honest, so it's good to be able to understand how it can be used and how you might advise your patrons.
Last but certainly not least, **qualitative** researchers attempt to describe and interpret human behavior based primarily on the words of selected individuals ('informants', 'respondents', or 'participants' typically) and/or through the interpretation of their material culture or occupied space. The advantage of using qualitative methods is that they generate rich, detailed data that leave individuals' perspectives intact and provide multiple contexts for understanding the phenomenon under study. Qualitative methods are used by a wide range of fields, such as anthropology, education, nursing, psychology, sociology, and marketing. Qualitative data has a similarly wide range: observations, interviews, documents, audiovisual materials, and more. You may hear this as "unstructured data," but that's just plain wrong. How are digital images, literal grids filled in with color, "unstructured??" How are interviews, which tend to follow a set of questions, "unstructured"?? Or social media data, which has directionality?? So don't call it unstructured is my main point :)
The choices you make as a researcher working with text, images, sounds, networks/relationships, are determined by theoretical framework and that is qualitative research – e.g. grounded theory, or phenomenology, to inform choices to code from voices of participants vs. inductive coded theory. Studies that generate qualitative data can fall into certain categories of design, such as:
+ *Naturalistic* – studying real-world situations as they unfold naturally; nonmanipulative and noncontrolling. In these studies, the researcher is open to whatever emerges -- there is not hypothesis, no predetermined constraints on findings.
+ *Emergent* – acceptance of adapting inquiry as understanding deepens and/or situations change; the researcher avoids rigid designs that eliminate responding to opportunities to pursue new paths of discovery as they emerge.
+ *Purposeful* – cases for study (e.g., people, organizations, communities, cultures, events, critical incidences) are selected because they are "information rich” and illuminating. That is, they offer useful manifestations of the phenomenon of interest; sampling is aimed at insight about the phenomenon, not empirical generalization derived from a sample and applied to a population.
There are five, not necessarily sequential, components in qualitative research designs. How they are presented depends upon the research philosophy and theoretical framework of the study, the methods chosen, and the general assumptions underpinning the study:
1. *Goals* which describe the central research problem being addressed but avoid describing any anticipated outcomes.
- Questions to ask yourself if you were designing a study to gather and analyze qualitative data might be: what issues do you want to clarify, and what practices and policies do you want it to influence?
2. *Conceptual Framework*, which is the theories, beliefs, and prior research findings will guide or inform your research.
- Questions to ask yourself are - what do you think is going on with the issues, settings, or people you plan to study? What literature, preliminary studies, and personal experiences will you draw upon for understanding the people or issues you are studying?
3. *Research Questions*: Usually there is a research problem that frames your qualitative study and that influences your decision about what methods to use, but qualitative designs generally lack an accompanying hypothesis or set of assumptions because the findings are emergent and unpredictable. More specific research questions are usually the result of an iterative design process rather than the starting point.
4. *Methods*: Structured approaches to applying a method or methods to your study help to ensure that there is comparability of data across sources and researchers and they can be useful in answering questions that deal with differences between phenomena and the explanation for these differences. An unstructured approach allows the researcher to focus on the particular phenomena studied. This facilitates an understanding of the processes that led to specific outcomes, trading generalizability and comparability for internal validity and contextual and evaluative understanding.
- Questions to ask yourself are - how structured or unstructured should my study design be to get the data that would best help me understand the phenomena I am studying?
- Researchers utilize many methods of qualitative data collection throughout their studies, such as:
- Direct Observation, which is learning about behaviors and interactions in natural settings (like someone's house, or out in a park).
- Oral History, which many of you may know from the DH and archives classes you've taken. These are a series of in-depth interviews conducted with one or multiple participants over an extended period of time.
- Autoethnography, which is self-reflection and writing to explore anecdotal and personal experience, and connect this autobiographical story to wider cultural, political, and social meanings and understandings.
- Document review, a systematic procedure for analyzing and interpreting data generated from documents. In qualitative research, document analysis is often used to corroborate findings from other data sources such as interviews.
5. *Validity*: Qualitative researchers must attempt to rule out most threats to validity after the research has begun by relying on evidence collected during the research process itself. This is in order to effectively argue that any alternative explanations for a phenomenon are implausible.
- Questions to ask yourself are: How might your results and conclusions be wrong? What are the plausible alternative interpretations and validity threats to these, and how will you deal with these? How can the data that you have, or that you could potentially collect, support or challenge your ideas about what's going on? Why should we believe your results?
That brings us to triangulation, which is used by researchers analyzing qualitative data to bring more validity to their study. Triangulation is a process of verification that increases validity by incorporating three different viewpoints and methods. Triangulated techniques are helpful for cross-checking, or for seeking out varying perspectives on complex issues and events. You can triangulate your study with different techniques in qualitative research. For instance, you might do in-depth interviews, document review, and direct observation! If you want to take a mixed-methods approach, you could do in-depth interviews, document review, and summary statistics.
Ok, let's end with the strengths and challenges when working with qualitative data. Key strengths include the small sample size -- which is also a limitation. It is really hard (some say impossible) to generalize your conclusions from qualitative data. However, this means that the data you are gathering are more in-depth, and can shed light on the why of phenomena. Similarly, the fact that researchers are often deeply embedded in the cultures and experiences of others is both a strength and a challenge of working with qualitative data. Its a challenge because the embeddedness increases the opportunity for bias to enter into the way data is gathered, interpreted, and reported. It's a strength because it often provides really in-depth data that might not have been available without such embeddedness -- you get a more realistic view of the lived world.
However, researchers can arrive at vastly different interpretations of that view, depending on the theoretical framework they work under. A second wave feminist might analyze the same data as a Marxist, and come away with vastly different conclusions. Another key consideration for analyzing qualitative data is that research using human subjects increases the chance of ethical dilemmas that potentially undermine the overall validity of the study, which we've all seen through the various retractions and leaks from researchers (I still think about the [OKCupid data dump](https://www.vox.com/2016/5/12/11666116/70000-okcupid-users-data-release) from time to time...). Lastly, qualitative research is quick to respond to any changes that might occur when conducting a study, which is fortuitous because data gathering and analysis are way more time consuming and sometimes more expensive than other types of research. Imagine interviewing 40 people for one hour. If you can't afford a couple thousand US dollars for transcription, then you spend roughly 80 hours transcribing all those interviews. The analysis process, which we'll discuss more in week 5, involves reading and re-reading those interviews. It's a long process!! But worth it for many of the reasons I've explained above. I do mostly qualitative research now to be honest, and I might not go back.
## Homework 02 {-}
Pick a type of data to work with – either quantitative, qualitative, or GIS – and then follow the instructions underneath the headings. ONLY PICK ONE TYPE OF DATA. There is no need to do the work for all 3 types (unless you really want to, but I won't give extra points for it 😅). "Big" was left out because I do not have the compute resources readily available to give you to do any homework with large datasets – sorry!
**Qualitative**
Let's do a deeper dive into some open qualitative data.
1. Examine these two collections of data and the associated metadata:
- https://data.qdr.syr.edu/dataset.xhtml?persistentId=doi:10.5064/F6CN723S
- https://data.qdr.syr.edu/dataset.xhtml?persistentId=doi:10.5064/F6PN93H4
2. Based on your in-depth examination of the data and metadata, please answer the following questions for each data collection:
- Why are some datasets in the collection private and some public?
- What are some of the ethical considerations you might mull over when requesting to access data from this collection?
- What are some of the ethical considerations you might mull over when granting access to data to fellow researchers?
- Describe the datasets in relation to the idea that qualitative research is about immersion in a given community; that the information gathered is a gift.
- A researcher comes to you with interview audio and transcriptions they collected via fieldwork among an at-risk community in Turkey. They want to know if they can release a redacted version of the transcripts to the general public. What do you advise?
*BONUS QUESTIONS*
3. Find an example of non-textual qualitative data and hand it in with the answers to the above.
4. Is the data FAIR?
**Quantitative**
1. Download and examine these four datasets and their metadata:
- https://www.openicpsr.org/openicpsr/project/100094/version/V1/view
- https://www.kaggle.com/neuromusic/avocado-prices
- https://www.openicpsr.org/openicpsr/project/100117/version/V1/view
- https://osf.io/zafr6/
2. Based on your in-depth examination of the data and metadata, please answer the following questions for each dataset:
- What type of quantitative data is represented in the datset?
- Do you understand how the data was gathered or generated from the information provided?
- Could you use the dataset as-is without much cleaning? If no, why not? What needs to be cleaned?
- What are the limitations of the types of questions you might ask of this data?
- A researcher comes to you asking for a dataset that describes the demographic information of a given neighborhood where there has been a lot of real estate development happening. What type of quantitative data might you advise they use?
*BONUS QUESTIONS*
3. Find some quantitative data that isn't microdata, statistics, or aggregate data and hand it in with the answers to the above.
4. Is the data FAIR?
**GIS**
Let's continue with comparing and contrasting the variety of GIS types. Hand-in the answers to these questions along with any derivatives of the files you made while answering the above questions (maps, subsets of the data, etc.).
1. Examine these four datasets and their metadata:
- https://geo.nyu.edu/catalog/nyu-2451-34171
- https://geo.nyu.edu/catalog/nyu-2451-34502
- https://geo.nyu.edu/catalog/nyu-2451-34495
- https://geo.nyu.edu/catalog/stanford-jt342yd7485
2. Either use the link to import the datasets directly into CARTO with the direct link via the catalog page, or download the datasets and upload them into [QGIS](https://www.qgis.org/en/site/) or your GIS program of choice. Answer the following questions about the process of playing with this data:
- Based on the data provided, can you tell me which school district has the most subway stops? And which school districts have the most public libraries nearby? BONUS: make a derivative map to show me your answer in addition to the written part.
- How can you use different types of GIS data to help you come to different conclusions?
- When might you use points over polygons, and why?
- When would you use raster data over vector data, and why?
- A researcher comes in with a query – they want to overlay a map of NYC from 1857 with a current map of NYC. How would you advise them? What GIS data types would you recommend they use to see the differences in the cityscape?
*BONUS QUESTION*
3. Is the data FAIR?